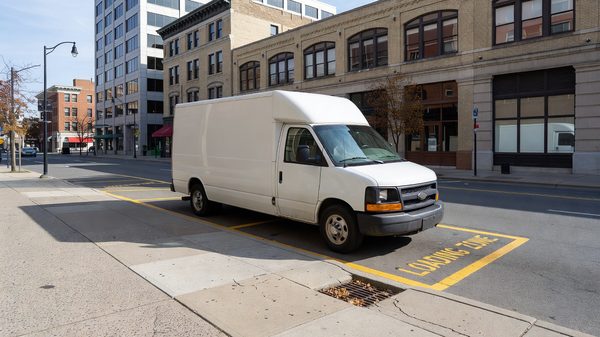
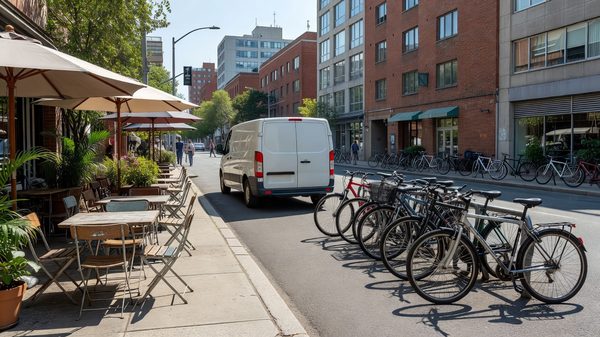
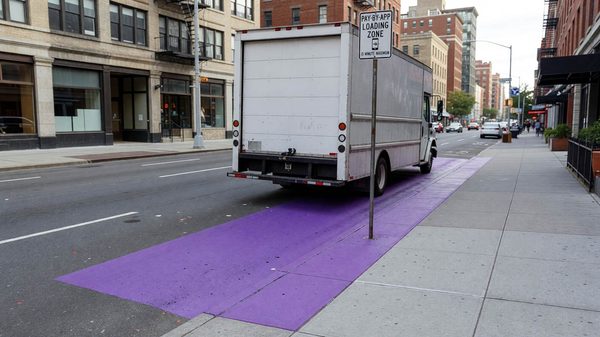
Loading zones are sized for an average Tuesday in June. From mid-November through late December they are asked to absorb the heaviest parcel and pickup traffic of the year, and the usual result is double-parked vans, blocked bike lanes and drivers circling for a space that a shopper is already using for a quick errand. Cities that handle the season well tend to have made their decisions in October, not December.
What the peak actually looks like
The national numbers set the scale. ShipMatrix projected that U.S. package deliveries in the 2025 peak season would rise about 5% over the prior year, to roughly 2.3 billion packages, the largest total since 2022, as reported by Supply Chain Dive. The same analysis expected FedEx and Amazon volumes to grow 5% to 8% while UPS and the U.S. Postal Service stayed roughly flat. The National Retail Federation reported that November and December 2025 sales grew 4.1% on its Retail Monitor data, and its October 2025 consumer survey found 55% of shoppers planning to make purchases online.
Those are national aggregates, and a curb manager cannot act on them directly. What matters locally is that the growth is concentrated in the carriers and retailers that make many short stops, and that retail pickup adds a second kind of demand: customers who stop for two to five minutes to collect an order and leave. A loading zone designed for a delivery driver with a hand truck is not designed for that pattern.
Aspen’s early smart-zone pilot gives a concrete picture of how steep the curve can be. Reported by GovTech, that pilot began in November 2020 with about 20 bookings and reached more than 125 bookings in the week before Christmas, with Tuesdays and Fridays as the busiest days and Wednesdays running nearly 60% below those peaks. It was a small resort-town program in an unusual year, so treat it as an illustration of timing and day-of-week variation rather than a forecast for a large city.
Time limits: the main lever
The simplest tool is the posted time limit, and the usual mistake is leaving one limit in place for every purpose.
Match the limit to the dwell
Commercial deliveries and retail pickups have different dwell times. Bellevue, Washington, converted two-hour parking to three-minute loading zones in 2020 to accommodate delivery surges, according to GovTech’s account of the pilot. Short limits turn a space over many times an hour; they also make a long stay obviously a violation, which helps enforcement.
Match the hours to the demand
Seattle’s Goods Morning pilot designated continuous stretches of curb as commercial vehicle load zones only from 6 a.m. to 11 a.m., Monday through Saturday, per SDOT’s flyer. A morning-only commercial window leaves the afternoon and evening, when holiday shoppers arrive, to passenger pickup and short-term parking. A city with the authority to change zone hours can post a November through December schedule with a sunset date, so the change does not become permanent by accident.
Add pickup space deliberately
If retail pickup is a major source of double-parking at a particular block, a signed pickup zone with a five or ten minute limit near the busiest stores is usually easier to enforce than trying to push those drivers into commercial loading zones that were never meant for them.
Enforcement during the peak
A time limit nobody enforces is a suggestion. Peak season is when enforcement capacity is thinnest, because staffing was set against a normal year.
Cities that have invested in sensors or camera-based monitoring can target patrols where dwell is exceeding the limit rather than walking a fixed route. Houston has piloted camera and license plate recognition fee enforcement in loading zones, and Philadelphia has expanded its smart loading zone program. Where that technology is not in place, enforcement planning can still be deliberate: identify the ten to twenty blocks with the worst blockage, assign officers to them during the heaviest afternoon hours, and publish the schedule so carriers can plan.
Two other measures matter as much as ticketing:
- Carrier communication. Large carriers and delivery platforms dispatch from systems that can receive zone locations and hours. A short notice in early November, naming the loading zones that change and the hours that apply, is cheap and reduces citations that no one wanted to issue.
- Business communication. Retailers who run pickup programs should know where customers are expected to stop. Merchants who are told where the pickup zone is will usually point customers to it.
The data to collect
The point of a peak-season program is to find out what the curb actually did. Without measurement, the next year’s plan repeats this year’s guesses. The minimum useful set is small:
- Occupancy by hour. What share of loading-zone time was occupied, by block, hour and day of week, compared against a pre-season baseline in October.
- Dwell time. Median and 90th percentile length of stay. A zone with a three-minute median and a 40-minute tail has an enforcement problem, not a capacity problem.
- Unauthorized use. Passenger vehicles in commercial zones and commercial vehicles double-parked beside empty zones. The second pattern is the signal that a zone is in the wrong place.
- Blockage events. Instances of a lane, crosswalk or bike lane being obstructed, with location and duration, which are often the real reason a city intervenes.
- Citations and complaints. Counts by block, so they can be compared against occupancy rather than read alone.
The Curb Data Specification gives cities a common format for much of this, which makes year-over-year comparison and sharing with carriers more practical than a spreadsheet kept by one analyst. Even a modest manual count on a dozen blocks, repeated on the same days each week from mid-November, is worth more than a larger dataset that begins on December 20.
Plan the season in reverse
Working backward from the peak: collect the October baseline, decide which blocks get seasonal hours or short-dwell signs, post them before Thanksgiving, notify carriers and merchants, put enforcement where the baseline shows blockage, and collect the same measures through the end of December. In January, compare the season against the baseline and decide which changes were worth keeping. The cities that do this once tend to find that two or three blocks account for most of the problem, and that fixing those blocks matters more than a citywide rule.