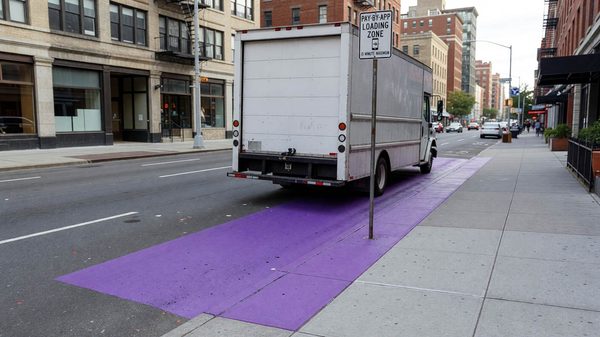
The Philadelphia Parking Authority expanded its Smart Loading Zone program from the original 22-block Center City pilot launched in May 2025 to 52 blocks, adding 30 blocks on the strength of measured improvements. The reported results: traffic speeds up 28% on Chestnut Street and 32% on Walnut Street, commercial vehicle use of designated loading zones up 97%, and an estimated 730 additional vehicles accommodated in the original 22-block footprint.
Those are strong numbers, and the program is one of the larger camera-based curb deployments in a dense US downtown. The release also contains a figure that gets less attention and tells a more useful story: a 51% compliance rate within the zones.
How the system works
Registered vehicles are charged 10 cents per minute of actual dwell through the CurbPass platform, with a one-hour maximum stay. A vehicle that remains in a zone more than three minutes without being registered, or that exceeds the posted time limit, receives an electronic $51 citation. The technology partner is Automotus.
Adoption is substantial: more than 49,500 CurbPass users as of August 2026, comprising roughly 41,100 personal accounts and over 8,000 vehicles across 145 fleet accounts.
The pricing is worth comparing to peer deployments. At 10 cents per minute with a flat structure, a 10-minute delivery costs $1.00 and a full hour costs $6.00. Philadelphia relies on the one-hour cap and the citation to limit long dwell rather than on an escalating rate. That is a simpler design to communicate, and it puts more weight on enforcement than on price signals to manage turnover.
The three-minute grace before an unregistered vehicle becomes citable is the other notable parameter. It is short enough to catch genuine loading activity, which is the point — the zone is for registered commercial use — but it means a driver who stops briefly without knowing the rules crosses into a $51 exposure quickly.
The compliance number is the real finding
A 51% compliance rate means roughly half of vehicles using these zones are not doing so within the rules — not registered, or over the limit. The PPA also reports that 78% of violators received only one citation.
Read together, these two figures describe a specific and mostly encouraging dynamic. Compliance is low in aggregate, but violation is overwhelmingly a one-time event rather than a pattern. That is the signature of a population learning a new system rather than a population deliberately defecting from it. A driver gets one $51 citation, registers for CurbPass, and does not appear again in the violation data.
It also means the headline improvements were achieved at 51% compliance. If the traffic-speed gains on Chestnut and Walnut are real at half compliance, the ceiling on this intervention has not been approached. The marginal work is not more blocks — it is converting the remaining half of users, which is a registration and communication problem rather than a coverage problem.
For a city evaluating a similar program, that reframes the business case. The expansion from 22 to 52 blocks extends the geography of a system that is operating at half its behavioural potential in the blocks it already covers.
What the release does not establish
The methodology is not stated, and neither is the baseline or comparison period for the traffic-speed figures.
This matters more than it might seem. Traffic speeds on Chestnut and Walnut are affected by construction, signal retiming, transit changes, weather, seasonal demand, and the general post-2020 drift in downtown travel patterns. A 28% increase measured against an unspecified prior period, with no control corridor, does not separate the program’s effect from everything else that changed on those streets.
That is not an accusation that the numbers are wrong. Smart loading zones plausibly do increase travel speeds, because the mechanism is clear: a delivery vehicle in a loading zone is a delivery vehicle not double-parked in a travel lane, and on a two-lane street removing one blockage restores more than half the capacity. The mechanism is sound and the direction is almost certainly right.
But a municipal program reporting its own results should state the comparison period and the measurement approach, and other cities should ask for both before treating these figures as a planning input. The 97% increase in commercial vehicle use of designated zones is the more defensible number, because it is measured by the system itself against its own prior state rather than inferred from street-level speeds.
The 730-vehicle capacity figure is similarly an estimate, stated as such, for the original 22-block area rather than the expanded footprint.
What transfers to another city
Several design choices here are worth copying regardless of vendor.
Enforcement as a teaching mechanism. The 78% single-citation figure suggests the $51 citation functions primarily as a registration prompt. A city adopting this model should expect and plan for a large first-wave citation volume that declines, and should resist reading early citation revenue as a durable line item.
A warning period before enforcement. Philadelphia ran a 30-day warning period on the expanded blocks before citations began. Given that compliance is a learning problem, this is not a courtesy — it is the mechanism that converts users without generating the political cost of a citation wave.
Separate registration metrics from coverage metrics. The useful dashboard for this kind of program is compliance rate per block and registrations over time, not blocks deployed. Philadelphia’s own data show why: the coverage more than doubled while compliance sat at 51%.
The question worth asking at the next milestone is whether compliance in the original 22 blocks has risen since launch. If it has, the model works and expansion is justified. If it has plateaued near half after fifteen months, the binding constraint is registration friction, and no additional blocks will fix it.